Infrastructure
Runtime operations layer for monitoring deployed services, managing gateway connections, and debugging live systems.
What is Infrastructure?
The Infrastructure section provides real-time visibility into running M3 Forge services and their connections to Marie-AI backend gateways. Infrastructure focuses on operational monitoring — what services are deployed, how they’re performing, and what’s connected right now.
Infrastructure enables you to:
- Organize Runtime Fabric groups for group-first deployment targeting, health validation, and scheduler fan-out
- Operate Marie Execution Fabric for resource-aware DAG execution across heterogeneous AI and document-processing executors
- Monitor executor deployments across multiple gateways with health status and capacity tracking
- Manage webapp runners that host Gradio, Streamlit, and custom web applications
- Track gateway connections with health checks and bearer token authentication
- Register MCP servers to extend agent capabilities with external tools and services
- View live events from workflow executions and system operations
- Inspect capacity utilization to plan scaling and resource allocation
- Debug production issues with log aggregation and trace inspection
- Query service registry for discovering available endpoints and capabilities
Infrastructure vs Administration vs Self-Hosting
Understanding the distinction between these three sections:
| Section | Focus | Examples |
|---|---|---|
| Infrastructure | RUNTIME operations — monitoring what’s running NOW | Deployment status, executor health, capacity utilization, live logs |
| Administration | SETTINGS and configuration — managing users, roles, API keys | User management, RBAC, LLM provider connections, workspace settings |
| Self-Hosting | INSTALLATION and setup — how to deploy M3 Forge | Docker Compose, environment variables, database migrations, gateway config |
If you’re asking “What’s running and how is it performing?” — that’s Infrastructure.
If you’re asking “Who has access and what are my settings?” — that’s Administration.
If you’re asking “How do I install and configure M3 Forge?” — that’s Self-Hosting.
Key Capabilities
Deployment Monitoring
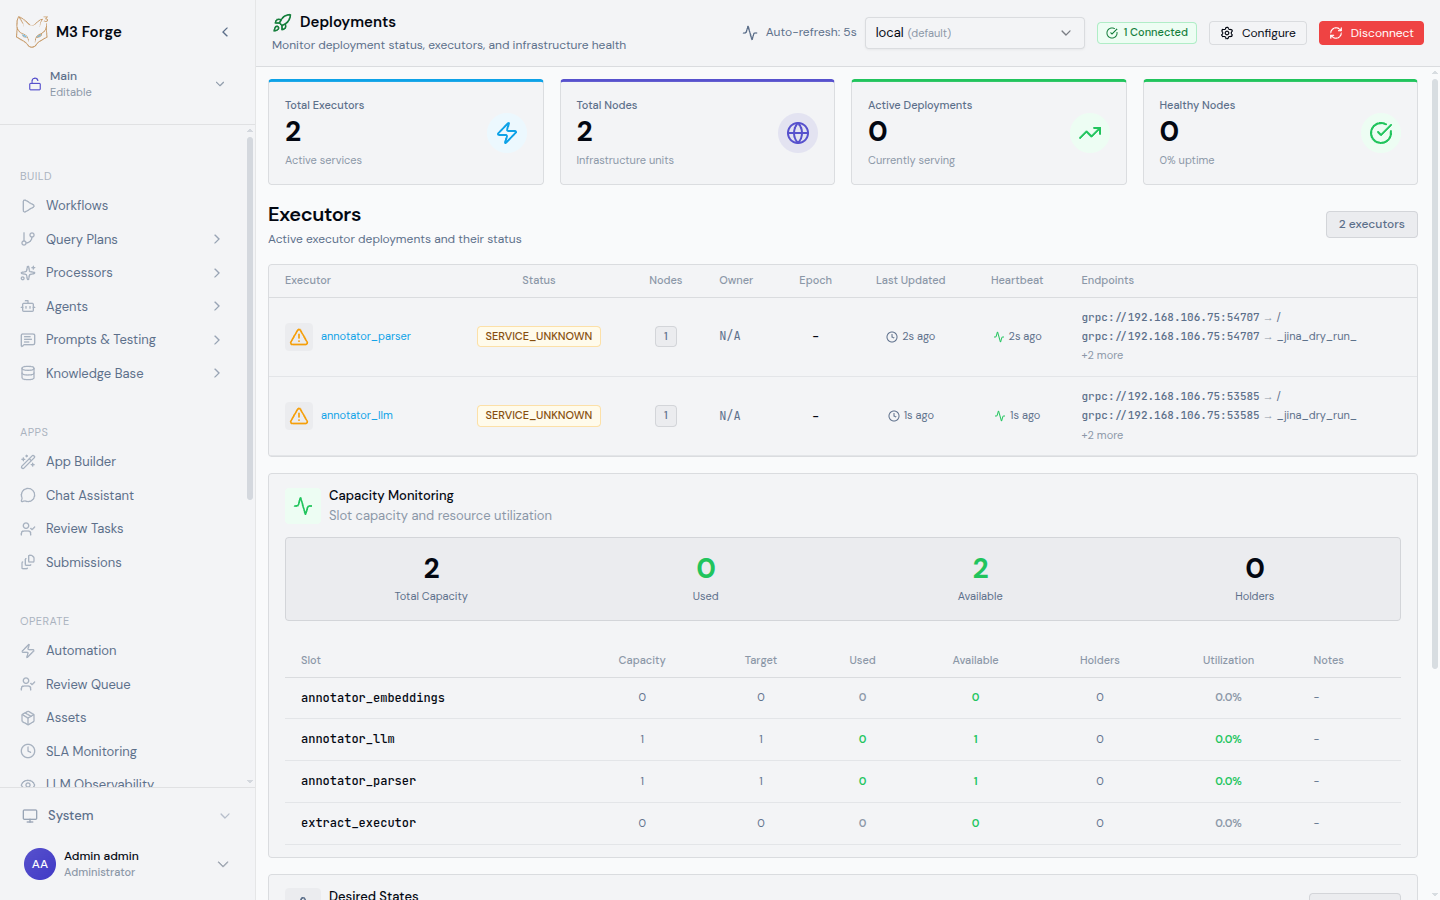
Track executor deployments across all configured gateways. Each deployment shows:
- Status metrics - Total executors, nodes, active deployments, healthy percentage
- Executor details - Name, status (SERVING/STOPPED/ERROR), node count, heartbeat timestamps
- Capacity tracking - Total/used/available slots, utilization percentages
- Desired states - Expected executor configuration grouped by epoch
- Multi-gateway support - Switch between gateways with health testing before data fetch
See Deployments for comprehensive monitoring features.
Runtime Fabric
Define homogeneous deployment targets on top of your gateways:
- Fabric groups - Group compatible gateways by environment, region, and runtime shape
- Health validation - Detect mismatched versions or capabilities before routing work to the group
- Group operations - Run scheduler pause/resume actions across all enabled gateways in a group
- Targeted releases - Publish templates and execute plans against a fabric group instead of picking one machine manually
- Drift visibility - Compare intended group state with what is actually materialized on each gateway
See Runtime Fabric for the control-plane model and daily operating workflow.
Marie Execution Fabric
Run heterogeneous document and AI workloads with DAG-aware, capacity-aware execution:
- Global ready frontier - Track dependency-satisfied work across submitted DAGs
- Priority planning - Select runnable work with global priority and SLA pressure in mind
- Typed executor capacity - Dispatch only when the matching executor class has available slots
- Lease-protected dispatch - Use database leases and slot reservations before work leaves the scheduler
- Page-scale workload support - Fan out document pipelines across thousands of pages and many dependent jobs
- Throughput planning - Estimate capacity from effective slot occupancy for each executor class
See Marie Execution Fabric for the scheduler and executor model.
Webapp Management
Manage webapp runners and deployed web applications with full lifecycle control:
- Webapp lifecycle - Create, start, stop, redeploy web applications
- App types - Gradio, Streamlit, FastAPI, static sites, custom Docker containers
- Git integration - Deploy from Git repositories with branch tracking and status monitoring
- Log viewing - Real-time logs streamed via SSE for each webapp
- Runner health - Monitor webapp runner status, capabilities, and active webapp count
- Deployment history - View past deployments with timestamps and outcomes
See Webapps for webapp deployment and management.
Gateway Connections
Monitor and manage connections to Marie-AI backend gateways:
- Health checks - Automatic 5-second interval health testing with status indicators
- Gateway configuration - Read from environment variables, conventional paths, or config files
- Bearer token authentication - Secure gateway access with
GATEWAY_TOKEN_<ID>env vars - Multi-gateway switching - Select active gateway from dropdown with health validation
- Connection diagnostics - Test connectivity before attempting data operations
See Gateways for gateway configuration and health monitoring.
Event Tracking
View and analyze events from workflow executions and system operations:
- Event streams - Real-time display of workflow events, LLM calls, validation results
- Event details - Timestamps, event types, payloads, associated workflow/node IDs
- Filtering - By workflow, event type, time range, severity
- Vector embeddings - Event payloads stored with embeddings for semantic search
- Audit trail - Complete history of system events for debugging and compliance
See Events for event monitoring and inspection.
Capacity Management
Track resource utilization across executor deployments:
- Capacity overview - Total, used, and available capacity across all gateways
- Slot tracking - Individual capacity holders with utilization percentages
- Resource planning - Identify over/under-provisioned executors
- Historical trends - Capacity usage over time to inform scaling decisions
See Capacity for resource tracking and planning.
Debugging Tools
Diagnose production issues with comprehensive debugging capabilities:
- Log aggregation - Centralized logs from all services and executors
- Trace inspection - Follow request flows across distributed services
- Real-time updates - SSE-based log streaming with auto-scroll
- Error analysis - Stack traces, validation failures, timeout events
- Context reconstruction - Full execution context for workflow runs
See Debug for troubleshooting and diagnostics.
Service Registry
Discover available services, endpoints, and capabilities:
- Service catalog - All registered services with health status and uptime
- Endpoint discovery - REST and tRPC endpoints with schemas
- Capability listings - What each executor/runner supports
- Version tracking - Service versions and compatibility matrix
See Registry for service discovery and documentation.
Infrastructure data is fetched in real-time from Marie-AI backend gateways. Ensure gateways are configured and healthy before using Infrastructure features.
Real-Time Updates
Infrastructure views use Server-Sent Events (SSE) and auto-refresh intervals for real-time monitoring:
- Health checks - Every 5 seconds for gateway connectivity
- Deployment status - Every 10 seconds for executor heartbeats
- Log streams - Real-time SSE for webapp and workflow logs
- Event updates - Live event tracking with auto-scroll to latest
- Capacity metrics - Refreshed on-demand and every 30 seconds
This ensures you always see current system state without manual refresh.
Multi-Gateway Architecture
M3 Forge supports connections to multiple Marie-AI backend gateways simultaneously. Each gateway represents a separate cluster or environment:
Gateway selection is available in all Infrastructure views via a dropdown selector. The system tests gateway health before fetching data to avoid timeouts.
Getting Started
Runtime Fabric
Organize gateways into deployment targets, validate homogeneity, and operate group-level actions.
Execution Fabric
Understand Marie’s resource-aware DAG execution model for heterogeneous AI and document workloads.
Deployments
Monitor executor deployments, health status, and capacity across gateways.
Webapps
Manage webapp runners and deployed web applications with lifecycle control.
Gateways
Configure and monitor Marie-AI backend gateway connections.
MCP Servers
Register external MCP servers to extend agent tool capabilities.
Events
View real-time event streams from workflows and system operations.
Capacity
Track resource utilization and plan scaling across executors.
Debug
Diagnose production issues with logs, traces, and error analysis.
Registry
Discover available services, endpoints, and capabilities.
Best Practices
Gateway Configuration
For production deployments:
- Use environment variables for bearer tokens - Store
GATEWAY_TOKEN_<ID>in secure secrets management - Configure multiple gateways - Redundancy and geographic distribution
- Test connectivity before use - Health checks prevent timeout errors
- Monitor gateway health - Set up alerts for gateway downtime
Resource Monitoring
Track capacity proactively:
- Set capacity alerts - Notify when utilization exceeds 80%
- Review capacity trends - Identify growth patterns for scaling decisions
- Monitor executor health - Unhealthy nodes reduce available capacity
- Balance load across gateways - Distribute workloads geographically
Debugging Workflow
When investigating production issues:
- Check gateway health - Ensure connectivity to backend
- Review recent events - Look for errors or unusual patterns
- Inspect deployment status - Verify executors are SERVING and healthy
- Examine logs - Use Debug view for centralized log aggregation
- Compare capacity - Ensure sufficient resources for workload
Security Considerations
Gateway Authentication
- Bearer tokens required - All gateway API calls use
Authorization: Bearer <token>headers - Token storage - Tokens stored in environment variables, never in frontend code
- Token rotation - Update
GATEWAY_TOKEN_*env vars and restart API server - Per-gateway tokens - Each gateway has independent authentication
Access Control
Infrastructure data access is role-based:
- Admins - Full access to all Infrastructure views and operations
- Operators - View-only access to deployments, events, capacity
- Developers - Access to logs and debugging tools for their workflows
- Viewers - No access to Infrastructure section
Audit Logging
All Infrastructure operations are logged:
- Gateway configuration changes
- Webapp deployments and lifecycle operations
- Debug log access with filter criteria
- Capacity threshold violations
Next Steps
- Configure gateway connections to Marie-AI backends
- Monitor executor deployments and health status
- Set up webapp runners for Gradio and Streamlit apps
- Track capacity utilization for scaling decisions
- Use debugging tools to diagnose production issues